eTold Background Information
For comments about this file, email to:
paul@kinzelman.com
Last updated Sept 25, 2011
This page is meant primarily for non-aviation people who are interested
in an explanation of the importance of calculating takeoff and landing
peformance data.
Why etold?
On every commercial flight on a jet, the pilots must calculate takeoff
and landing performance. For a given weight, temperature, elevation,
runway condition (dry vs snow, etc.) and aircraft configuration, a
calculation must be done to come up with a set of performance numbers
(takeoff distance, speed, etc.). This is called Takeoff and Landing
Data (TOLD). This must also come from FAA-approved sources like the
Airplane Flight Manual (AFM).
While this applies to all jets, large transport jet companies (737's,
Airbusses, etc.) have dispatch departments that have software which
figures all that stuff out and gives a printout to the pilots.
Smaller modern jets with a lot of automation have computation equipment
on board which figures out the TOLD data as well.
But for smaller and older business jets, like Learjets, Cessna
Citations, etc., the
pilots must do this calculation. For vanilla cases, no wind, etc.,
he can use tables that contain a set of datapoints. If the conditions
don't match the datapoint in the tables, he must interpolate, often
in multiple directions. And the quick tables have no wind correction,
although ususually if there's wind, it'll be a headwind which means
the actual performance will be better than the tables would show.
Alternatively, the long way is to go into the AFM and spend much time
applying the conditions to numerous graphs in sequence to come up with
the performance numbers. This takes a long time and is quite error
prone. As a result, pilots don't often do this.
As an aside and precautionary note, performance
isn't an exact science as you might think, because the book numbers are
for a highly-proficient test pilot, clean airplane (no bugs on the
wing, etc.), in other words, ideal conditions. It's like doing
high-school physics with massless pulleys and frictionless planes,
and then trying to apply it to real life.
So I wrote a program (etold) into which I digitized the relevant
performance graphs to do the graphical analysis quickly. In addition,
instead of having to type in the weather conditions and look up the
elevation, runway lengths, etc., etold goes out onto the internet
and finds this information and fills it in for the pilot.
The calculations are all done by mathematically interpolating
piece-wise linear approximations of the graphs in the back of the
AFM. Some of the contaminated runway data from the AFM are in the form
of tables, and so I typed in the tables as-is and do a 3-dimensional
interpolation when values are needed between given values in the
tables.
Program Screenshots on the Palm Pre
I've put the screen-shots on the web and provided URLs (links).
I've currently implemented the program on the Palm Pre smart-phone.
The program has four basic screens (due to the small size of the phone):
- Departure weather
- Departure TOLD data
- Arrival weather
- Arrival TOLD data
However, note that all the numbers are bogus for these screen shots
because I'm using the emulator which does not do actual
calculations. But it does show you what the screen looks like. The
phone has properly-calculated numbers of course.
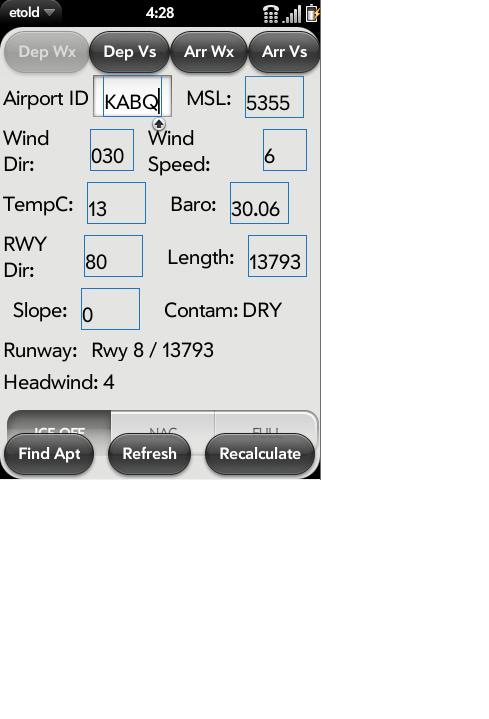
The first screen you see when you start the program (after the
disclaimer) is the Dep Wx screen, I have 3 screenshots illustrating
the screen as you scroll down:
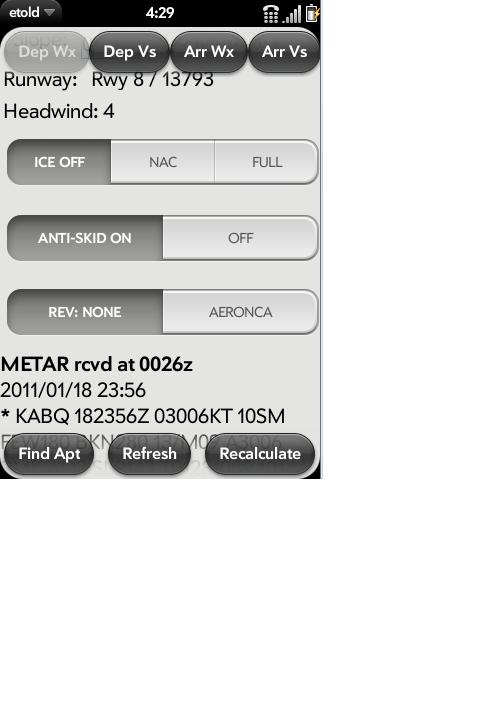
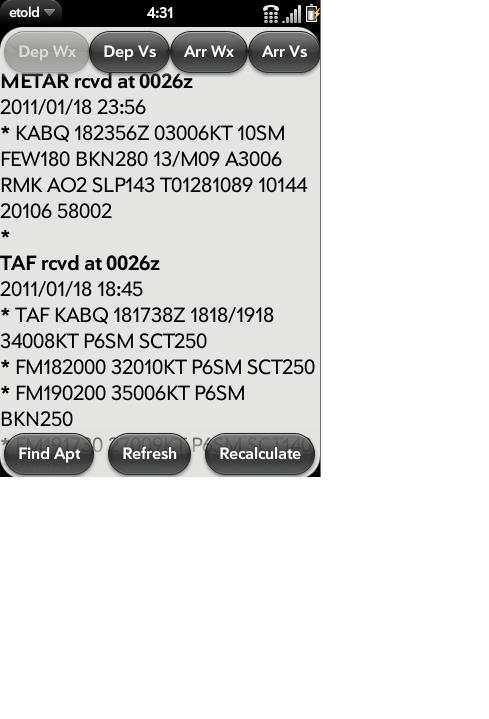
In the top screen you type in the airport and tap on "Find Apt" on the
bottom left. This will cause the phone to go onto the internet to
government databases to get the METAR and TAF (weather conditions) for
which you can see the raw data in the bottom shot. The program parses
the METAR data and puts the numbers in the proper places in the top
screen - wind direction and speed, temperature, etc. You can also
override any values you want manually, so if you aren't leaving for a
few hours and you think it'll be 4 degrees C hotter, you can plug in
that number.
etold will also go out and find the airport elevation and the set of
runways (directions, lengths, etc.) for that airport. You can then
select which runway you want to use, and say what kind of
contamination it has (dry, wet, ice, etc.). You have to put the slope
in manually.
You also set whether you'll take off with anti-ice off/nacelle/on,
anti-skid off/on, and what kind of engine nacelle you have - normal
or Aeronca reversers. I don't have any data for the Dee Howard ones.
Then you go to the "Dep Vs" screen to calculate the departure
data:
Select Flaps 8 or 20, and you can use the slider to select
your takeoff weight. etold then calculates all the numbers.
It also tells you how much fuel you must dump to get down to landing
weight for an emergency return. If you zero the dump, it'll still tell
you the correct Vref and landing distance for your overweight landing.
It also calculates your takeoff weight limit if the AFM graphs show
you to be limited to something lower than the normal takeoff weight
due to temperature.
Then you go to "Arr Wx" and select your arrival weather the same way
you selected your "Dep Wx". I didn't include a screen shot of this
because it's the same as the "Arr Wx" screen. Note you can select what
the runway contamination is for the arrival runway on this screen as
well.
Then you go to the "Arr Vs" screen to calculate your landing data:
You select your fuel burn (or dump) which determines your landing
weight. Select what regs you're flying under (91, 135, or
135-low-visibility). Select your flap setting. etold then calculates
all the numbers you see in the screen shot.
And again, etold calculates
your landing weight limit if the AFM graphs show
you to be limited to something lower than the normal landing weight
due to temperature.